
 The BBC is reporting that scientists have made the most precise map yet of the mountains, canyons and plains that make up the floor of Antarctica’s encircling Southern Ocean. Covering 48 million sq km (18.5 million sq miles), this chart for the first time details a new deepest point – a depression lying 7,432m (24,383ft) down called the Factorian Deep.
The International Bathymetric Chart of the Southern Ocean (IBCSO) has taken five years to compile and updates the first attempt at a comprehensive map, which was published in 2013.
The new map covers all the Southern Ocean floor poleward of 50 degrees South. If you divide its 48 million sq km into 500m grid squares, 23% of these cells now have at least one modern depth measurement.
Previously, IBCSO began only at 60 degrees South, and less than 17% of its grid boxes had a modern measurement.
“You have to realize just what the change from 60 degrees to 50 degrees means; we’ve more than doubled the area of the chart,” said Dr Boris Dorschel from Germany’s Alfred Wegener Institute.
“So, we’ve increased the area coverage, but we’ve also increased the data density, because, in parallel, we’ve kept on acquiring new data and knocking on doors to free up existing data,” he told BBC News.
Much of the information in the chart comes from the ice-strengthened ships that support scientific endeavors in Antarctica, including from the UK’s former polar ship, the RRS James Clark Ross. (In the future, this British contribution will come from its successor, the RRS Sir David Attenborough, affectionately known as Boaty McBoatface.)
The new map was made possible by financing from Japan’s Nippon Foundation and the support from Seabed2030, the international effort to properly chart Earth’s ocean floor by the end of the decade.
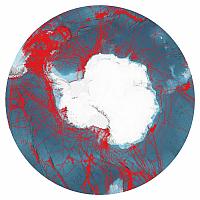
Antarctica: Southern Ocean floor mapped in greatest ever detail
Thanks to Alaric Bond and David Rye for contributing to this post.
“…knocking on doors to free up existing data,”
Paraphrasing the glib and slippery former secretary of defense, “There are known unknowns and unknown knowns” 🙂
“Maps”?
According to NOAA: A nautical chart represents hydrographic data, providing very detailed information on water depths, shoreline, tide predictions, obstructions to navigation such as rocks and shipwrecks, and navigational aids.
The term “map,” on the other hand, emphasizes landforms and encompasses various geographic and cartographic products. Some examples of maps might be road maps or atlases, or city plans. A map usually represents topographical information.
https://oceanservice.noaa.gov/facts/chart_map.html